Excel with 3D effect!
17Feb
I will show you how you can make the presentation of excel tables more attractive. I have already shown how to make your charts more attractive, and now I will show you how to create 3D graphics from tabular data. The image will naturally update every time the data is updated :-)
Step by step:
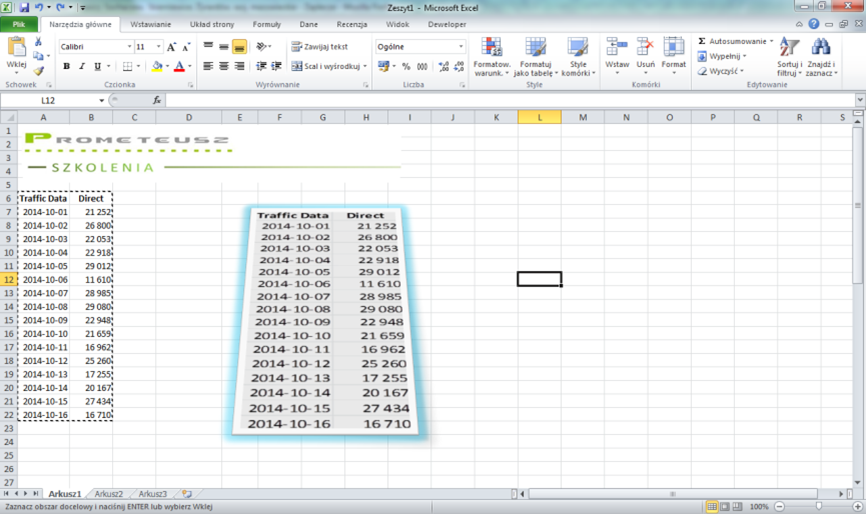
- select the data on the basis of which you want to frame the image
- copy them to memory
- Note - paste the data using the paste option
 linked image
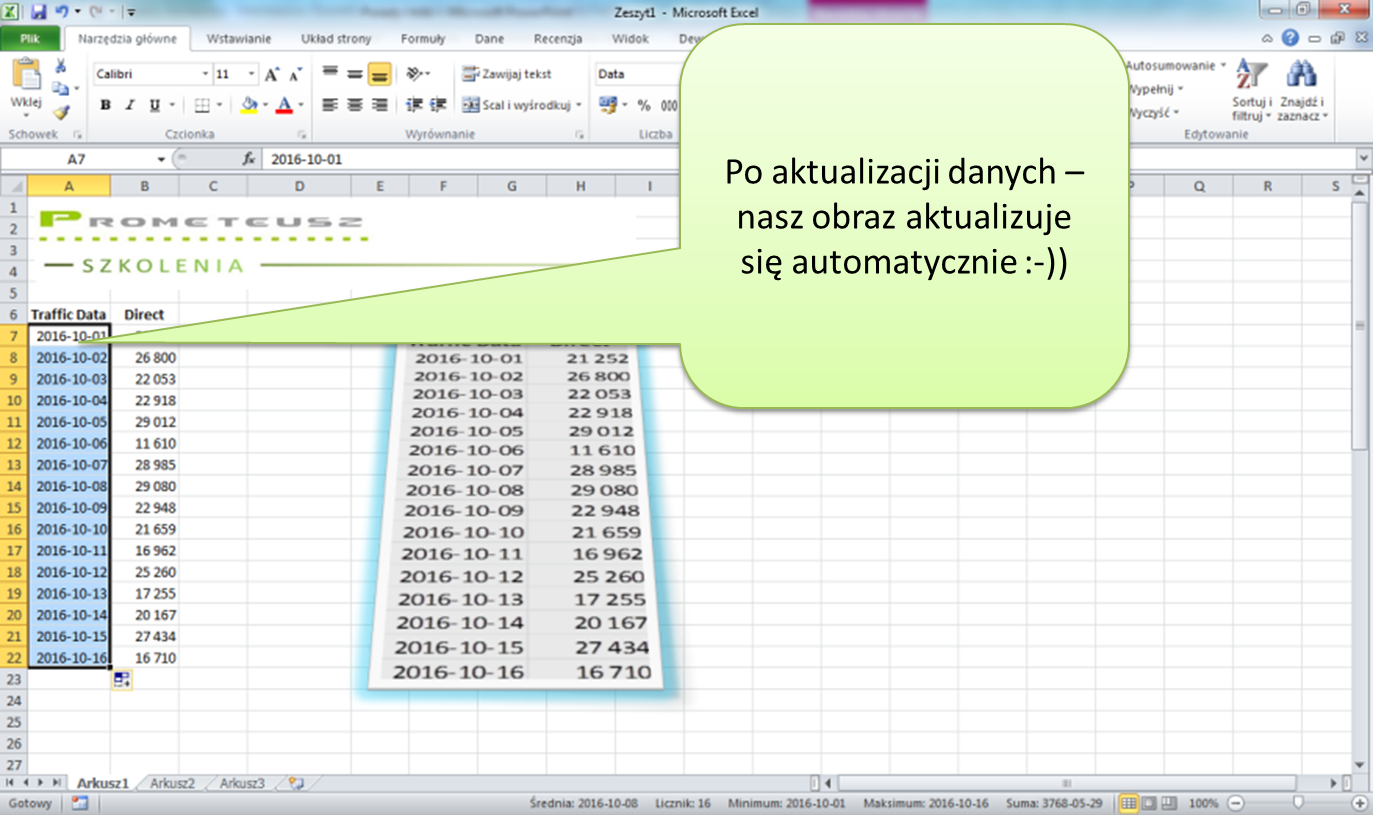
And here is the effect:
The graphics update automatically after changing the data:
Did you do it too?